Our team is committed to continuing to serve all your real estate needs while incorporating safety protocol to protect all of our loved ones.
In addition, as your local real estate experts, we feel it’s our duty to give you, our valued client, all the information you need to better understand our local real estate market. Whether you’re buying or selling, we want to make sure you have the best, most pertinent information, so we’ve put together this monthly analysis breaking down specifics about the market.
As we all navigate this together, please don’t hesitate to reach out to us with any questions or concerns. We’re here to support you.
– Vivian Yoon & Dennis Hsii, LIC #01925833 / 01919746
The Big Story
Where can home prices go from here?
Quick Take:
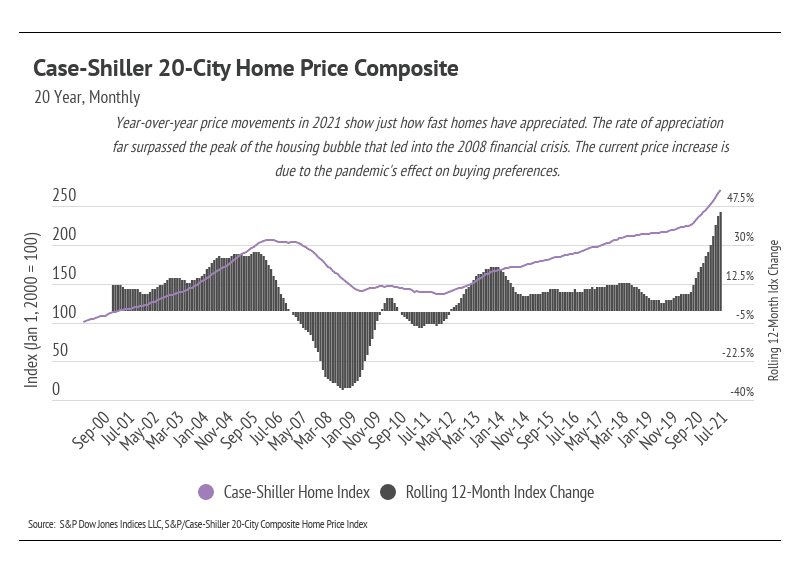
• Home prices appreciated faster in 2021 than at any other time, even surpassing the 2004–2006 housing bubble
• Home prices will probably decrease before returning to a more reasonable growth rate.
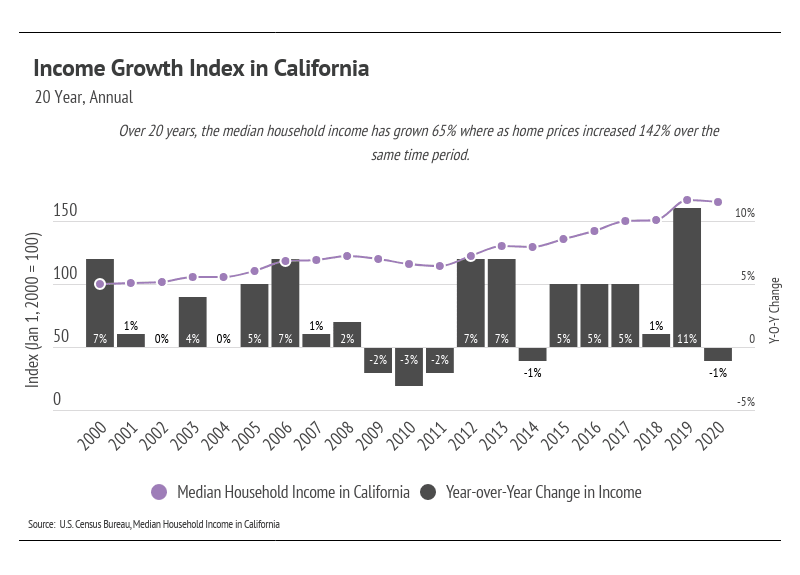
• Home prices in the last 20 years increased at more than twice the rate of the median household income in California (142% vs. 65%).
• Despite record low inventory, home price growth is hitting a ceiling.
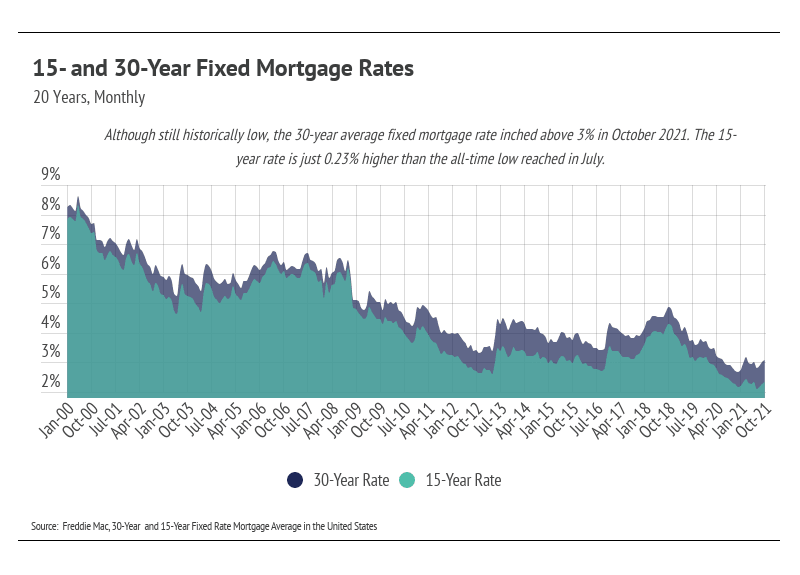
• The average 30-year fixed mortgage rate, while still historically low, rose to 3.14% at the end of October 2021.
Note: You can find the charts/graphs for the Big Story at the end of this section.
Highs (price) and lows (inventory) in the housing market
Income is one of the largest predictors of home price growth, second only to available supply. Consumers have more money to spend, which in turn drives up prices. But the increases in income haven’t kept up with the rise in home prices, especially in the last two years. In 2020, home prices increased 10% according to the Case-Schiller 20-City Composite Index, while median income decreased by 1%.
The disconnect between income and home prices is happening for two reasons. First, the ability to take on debt means that income doesn’t necessarily need to increase at a 1:1 ratio with home prices. Second, the pandemic changed buyer preferences, increasing the demand for homes and dropping inventory to previously unseen lows.
Because home price increases outpaced income growth, homebuyers needed to take on more debt to buy a home than they would have a few years ago. But due to the drop in interest rates, the monthly payment, even on a higher-priced home, becomes more affordable. For every 1% decrease in a 30-year mortgage rate, the price of the home can increase 13% without a change in monthly payment (and vice versa). For example, the monthly payment on a $1,000,000 mortgage at 4% is almost identical to the monthly payment for a $1,130,000 mortgage at 3%, a $130,000 difference.
The pandemic also changed buyer preferences. Rather than spending roughly half of our time at home, which is the norm, we were faced with endless time in our living spaces. (You remember — you were there.) As of September 2021, the United States has 59% fewer homes on the market, and 53% of that happened in the last two years. We were happy to see more homes on the market in the second quarter of 2021 because the increased supply helped satiate the high buyer demand, but we are already seeing the seasonal shift to fewer homes coming to market. Inventory will likely remain super low in the coming fall and winter months.
The market remains competitive for buyers, but conditions are making it an exceptional time for homeowners to sell. Low inventory means sellers will receive multiple offers with fewer concessions. With so many moving parts in real estate transactions, working with an experienced real estate agent is essential in smoothly navigating the entire buying and selling process.
Big Story Data
The Local Lowdown
The market is cooling but it’s still not a buyers’ market
We break down three luxury areas in Los Angeles as follows:
- North Beach: includes the Pacific Palisades, Santa Monica, and Venice
- West Side: includes Beverly Hills, Brentwood, West Hollywood, and Westwood
- South Bay: includes Hermosa, Manhattan Beach, and Redondo
Quick Take:
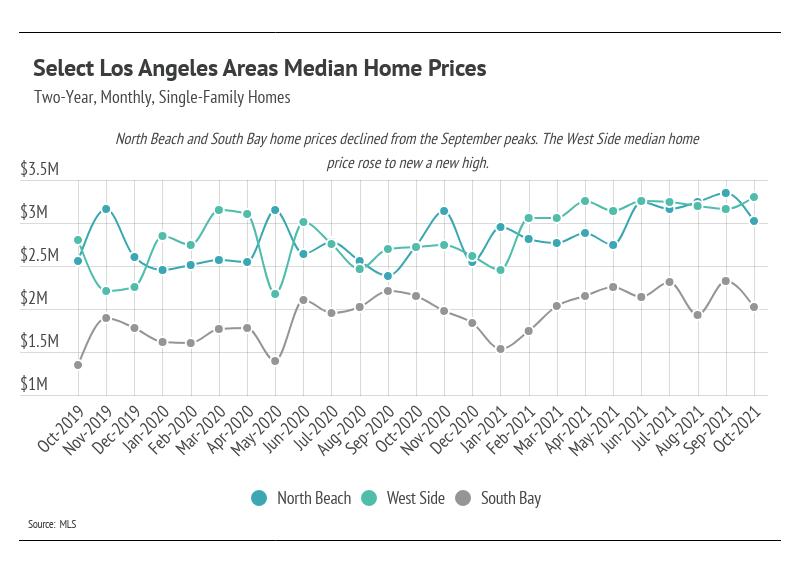
- Single-family home prices increased dramatically in 2021. From January through October, home prices rose across the selected markets:
- North Beach: +19%
- West Side: +29%
- South Bay: +10%
- Despite historically low inventory, the increase in home sales and speed of sales reflect the high demand in the select Los Angeles neighborhoods.
- Months of Supply Inventory further indicates a sellers’ market.
Note: You can find the charts/graphs for the Local Lowdown at the end of this section.
Single-family home prices moved like stocks in 2021
The growth rates in 2021 are highly unusual and unsustainable in these three luxury markets; for example, home prices would more than double every five years at a 15% growth rate (every four years at 20%). After huge single-family home price appreciation in the first half of the year, it made sense that prices pulled back in the summer months. From July–October, home prices declined in North Beach and the South Bay but remained historically high. West Side prices were the only exception, as they continued to appreciate and reached record highs in October.
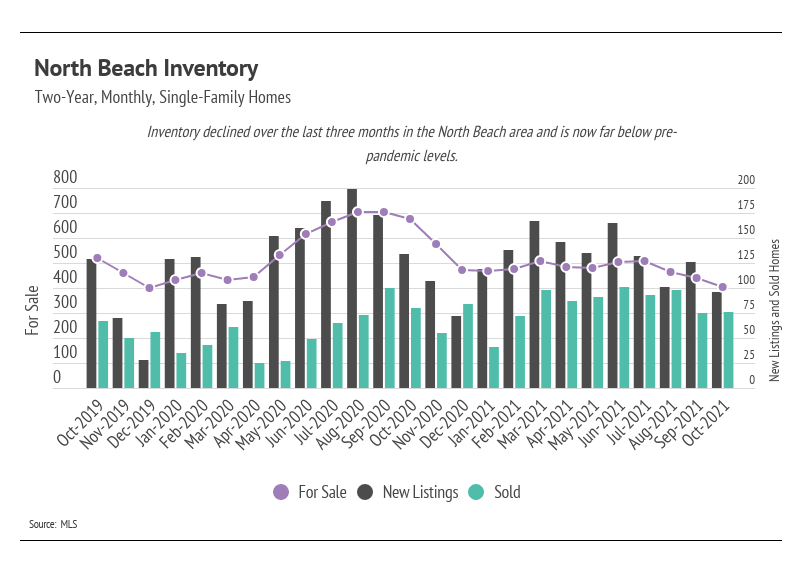
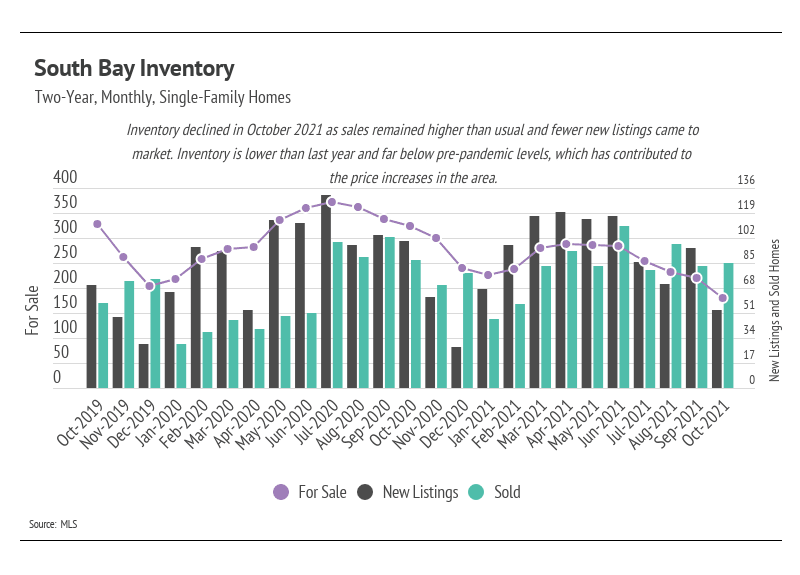
More supply, no problem
Despite the mild increase in single-family home inventory in 2021, we’re still at historic lows. August and September are typically the months with the highest inventory every year. In 2021, total inventory didn’t come close to last year’s level and was even further away from pre-pandemic levels. Even though we’re seeing some price correction after the first half of the year, the sustained low inventory will lift prices. Sales have been incredibly high, again highlighting demand in the area.
Homes are selling fast — really fast
Homes are selling extremely fast for these luxury markets. The Days on Market reflects the high demand for homes in these neighborhoods.
Months of Supply Inventory (MSI) quantifies the supply/demand relationship by measuring how many months it would take for all current homes for sale on the market to sell at the current rate of sales. The average MSI is three months in California, which indicates a balanced market. An MSI lower than three indicates that there are more buyers than sellers on the market (meaning it’s a sellers’ market), while a higher MSI indicates there are more sellers than buyers (meaning it’s a buyers’ market). Currently, single-family home MSIs are historically low, indicating a sellers’ market in the South Bay and a more balanced market in North Beach and the West Side.
Local Lowdown Data